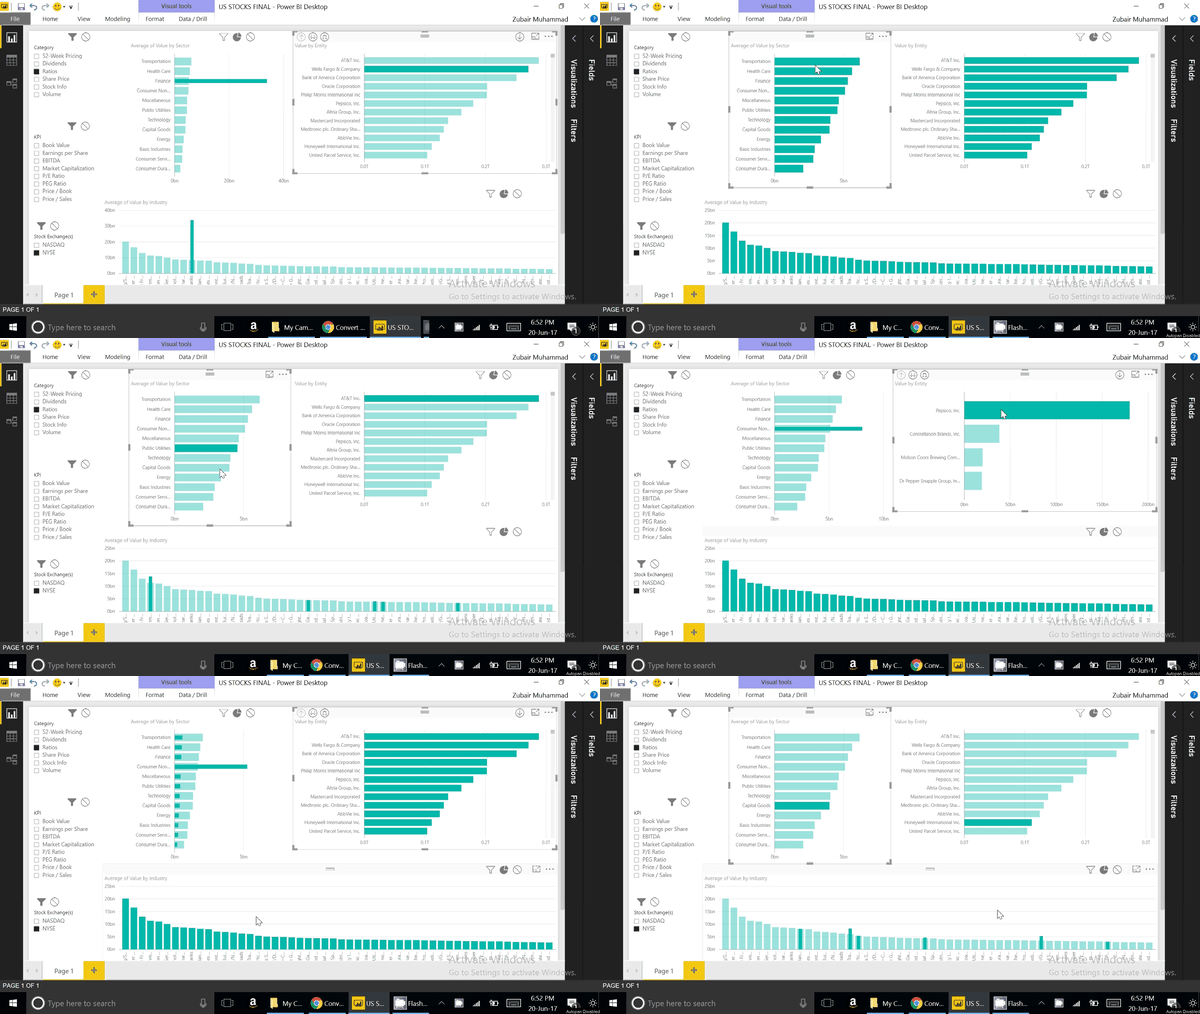
By default, Power BI data charts interact each other in the following manner.
i.e. An item selection in a chart highlights related items in other charts while dimming the color of unrelated items

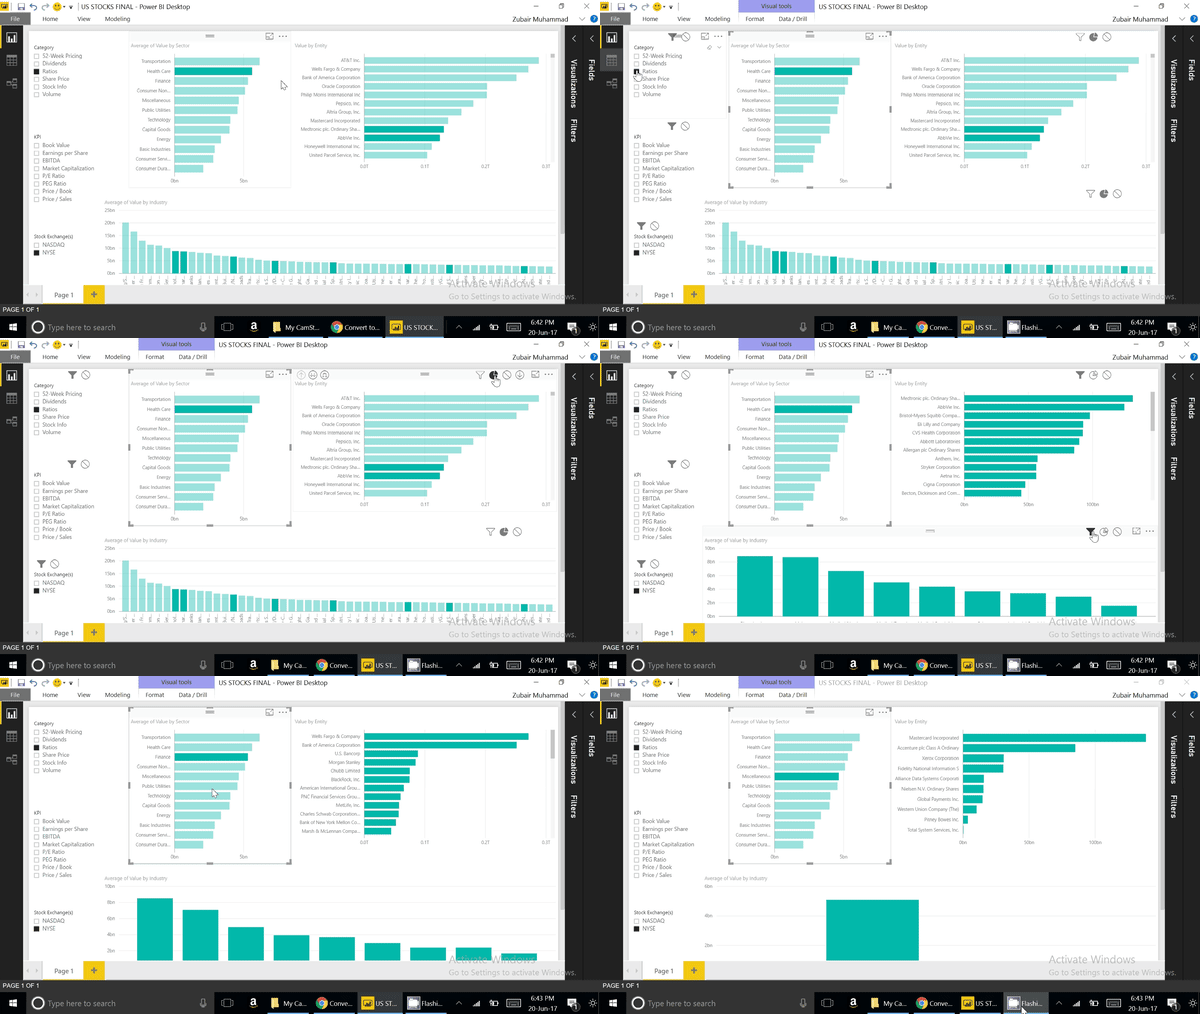
In some cases, for example when you have many items to display in the related chart, you would want to hide the unrelated items instead of dimming them.
To do this,
- Select the chart
- Go to Format Tab
- Click Edit Interactions
- Select the “Filter Option” instead of “Highlight Option in other charts”
This is illustrated in the animated image below
