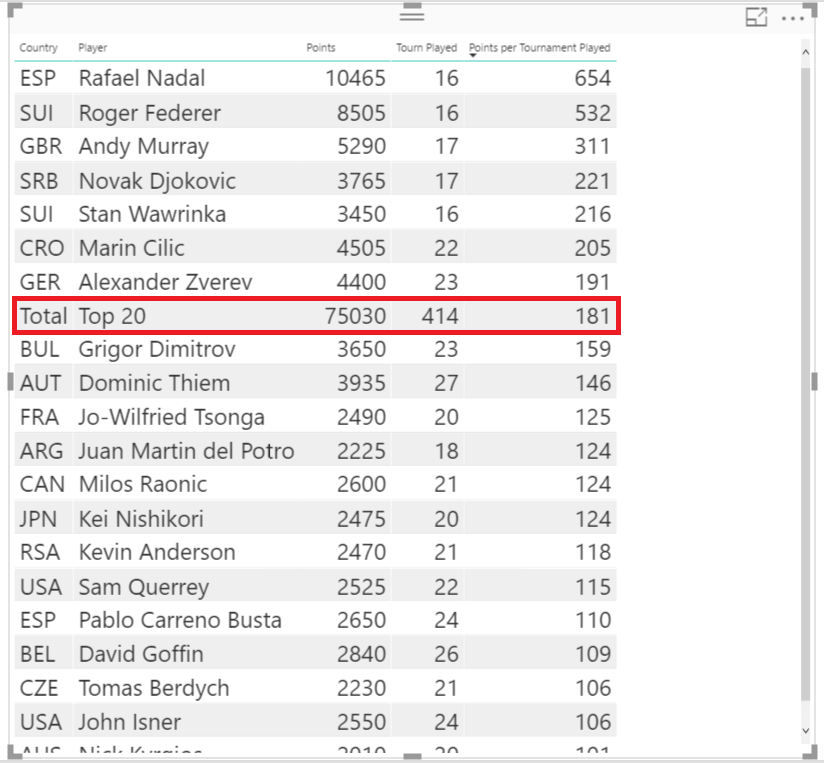
Totals are shown either at the beginning or the end of the VISUAL. However sometimes it is desirable to SORT the “Total” row as well
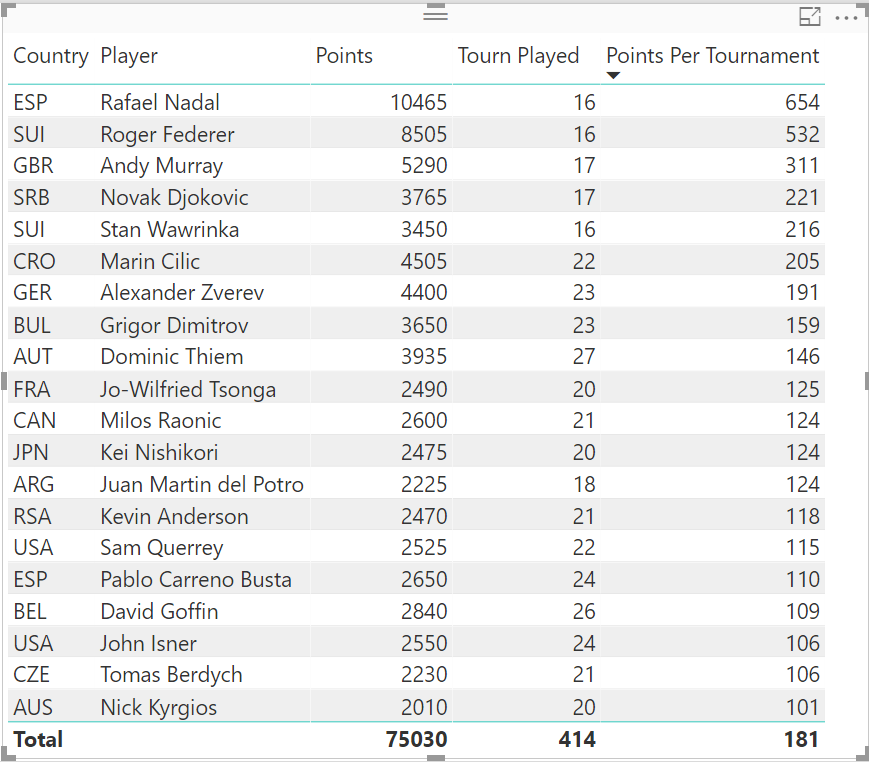
Consider the following example of Top 20 Tennis players. Points Per Tournament is a MEASURE (Points/Tourn Played).
The average points per tournament are 181 which are shown at bottom in the Table. The Table is sorted by Points per Tournament….however the TOTAL still remains at the bottom
What we would like to achieve is this
Here is the RAW data. Try doing it yourself before you look at the SOLUTION below
| Country | Player | Points | Tourn Played |
| ESP | Rafael Nadal | 10,465 | 16 |
| SUI | Roger Federer | 8,505 | 16 |
| GBR | Andy Murray | 5,290 | 17 |
| CRO | Marin Cilic | 4,505 | 22 |
| GER | Alexander Zverev | 4,400 | 23 |
| AUT | Dominic Thiem | 3,935 | 27 |
| SRB | Novak Djokovic | 3,765 | 17 |
| BUL | Grigor Dimitrov | 3,650 | 23 |
| SUI | Stan Wawrinka | 3,450 | 16 |
| BEL | David Goffin | 2,840 | 26 |
| ESP | Pablo Carreno Busta | 2,650 | 24 |
| CAN | Milos Raonic | 2,600 | 21 |
| USA | John Isner | 2,550 | 24 |
| USA | Sam Querrey | 2,525 | 22 |
| FRA | Jo-Wilfried Tsonga | 2,490 | 20 |
| JPN | Kei Nishikori | 2,475 | 20 |
| RSA | Kevin Anderson | 2,470 | 21 |
| CZE | Tomas Berdych | 2,230 | 21 |
| ARG | Juan Martin del Potro | 2,225 | 18 |
THE SOLUTION
To achieve desired result, we can create a NEW TABLE which contains all the rows of the Original Table plus the totals of all these rows. This can be achieved using the “ROW” function
Go to Modelling Tab>>>NEW TABLE and use this formula
New Table =
UNION (
 ROW (
 "Country", "Total",
 "Player", "Top 20",
 "Points", SUM ( TableName[Points] ),
 "Tourn Played", SUM ( TableName[Tourn Played] ),
 "Points per Tournament Played", [Points Per Tournament]
 ),
 SUMMARIZE (
 TableName,
 TableName[Country],
 TableName[Player],
 TableName[Points],
 TableName[Tourn Played],
 "Points per Tournament Played", [Points Per Tournament]
 )
)
The above formula simply combines
Original Table (along with the MEASURE “Point per Tournament”)
with
a ROW of Aggregate Values for Top 20 Players
You can Download the PBIX file here

