Following is a list of price of 3 fruits in 5 countries. Our objective is to determine the Country with the highest price for each fruit
| Fruit | USA | UK | France | Germany | Australia |
| Apples | 18 | 17 | 12 | 15 | 20 |
| Mangoes | 25 | 24 | 28 | 29 | 23 |
| Grapes | 40 | 34 | 34 | 36 | 31 |
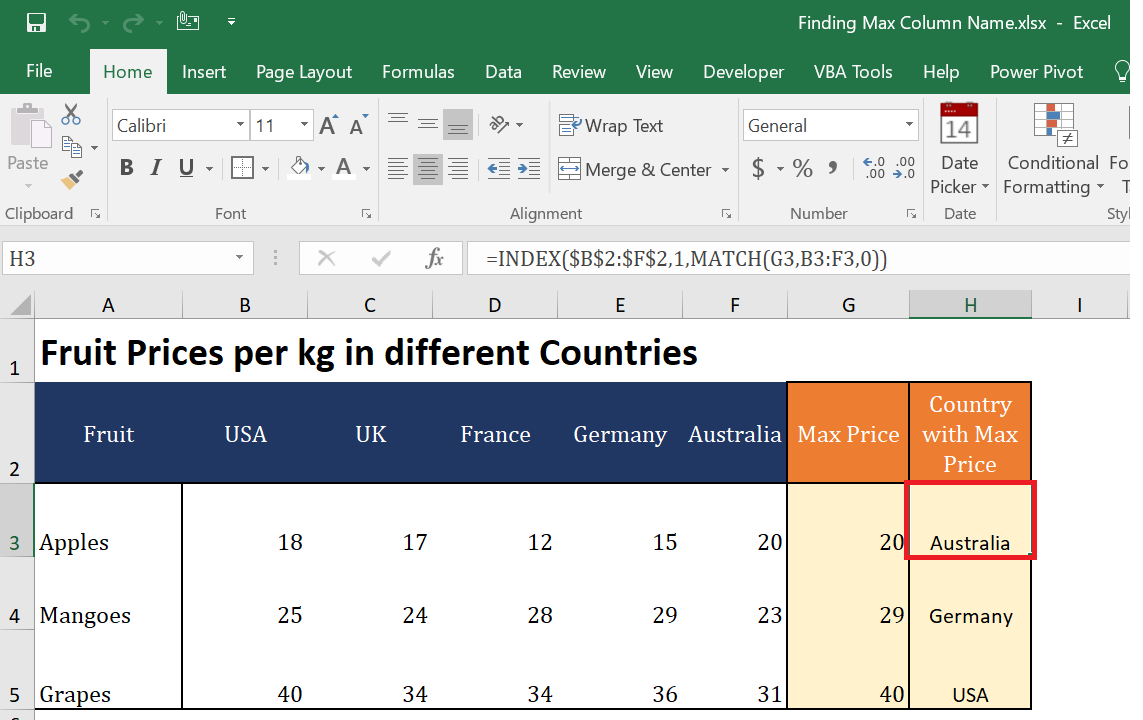
Microsoft Excel makes it so easy to determine this. We can quickly add another column for Maximum Value for each Fruit (each row). Then we can get the column for “Country with highest price” using a combination of Index and Match functions.
So for “Apples”…….. the Country with Maximum price is Australia and the picture below shows how easily it can be determined in Excel. Click here to Download Excel file
In Power BI, we need to use a different approach.
USING POWER QUERY
Query Editor or Power Query can get you the Maximum Value however. In the QueryEditor>>>Select the Country Columns>>>Goto “Add Column” Tab >>> Statistics>>>Maximum
Thats it… You can get the Maximum value but NOT the Column name with Maximum Value.
USING DAX
Our first step will be to transform or unpivot the data…so that the Country Names exist in Rows ….Not in Columns
In the Query Editor…Select the Columns with Countries >>> Unpivot
Change the default Name of “Attribute” Column to something logical. For example “Countries” in this example
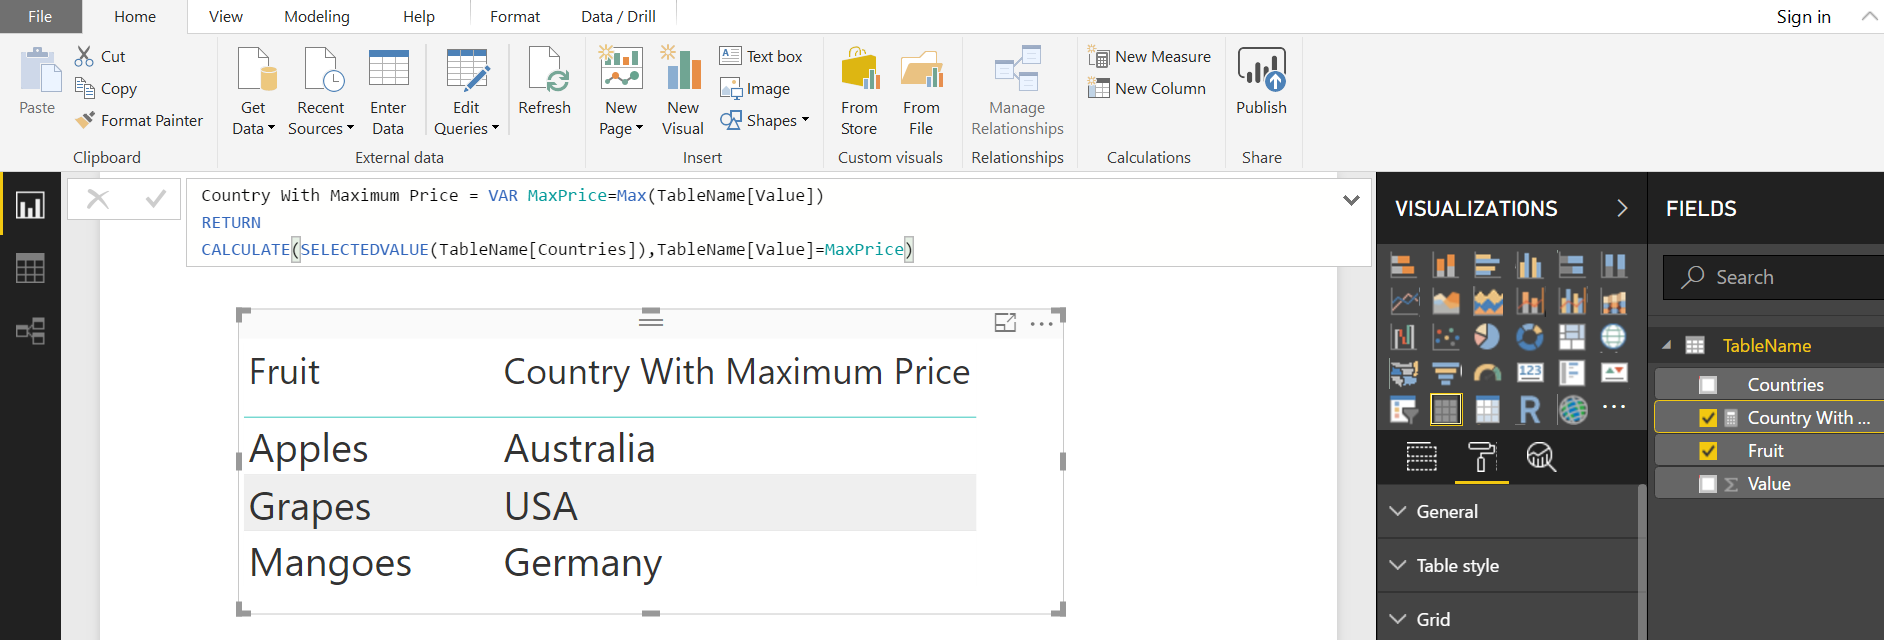
Now the Following DAX MEASURE will get you the Country with Maximum Price for each fruit
Country With Maximum Price =
VAR MaxPrice =
 MAX ( TableName[Value] )
RETURN
 CALCULATE (
 SELECTEDVALUE ( TableName[Countries] ),
 TableName[Value] = MaxPrice
 )
Click here to download the pbix File
BUT WHAT IF THESE COLUMNS ARE CALCULATED COLUMNS ???
In the above example we were able to unpivot the columns to get the name of the Column with Max or Min Value…..But what if the columns are calculated columns and thus can’t be unpivoted..
In this case there is another technique which is discussed in my another post. Link give below


