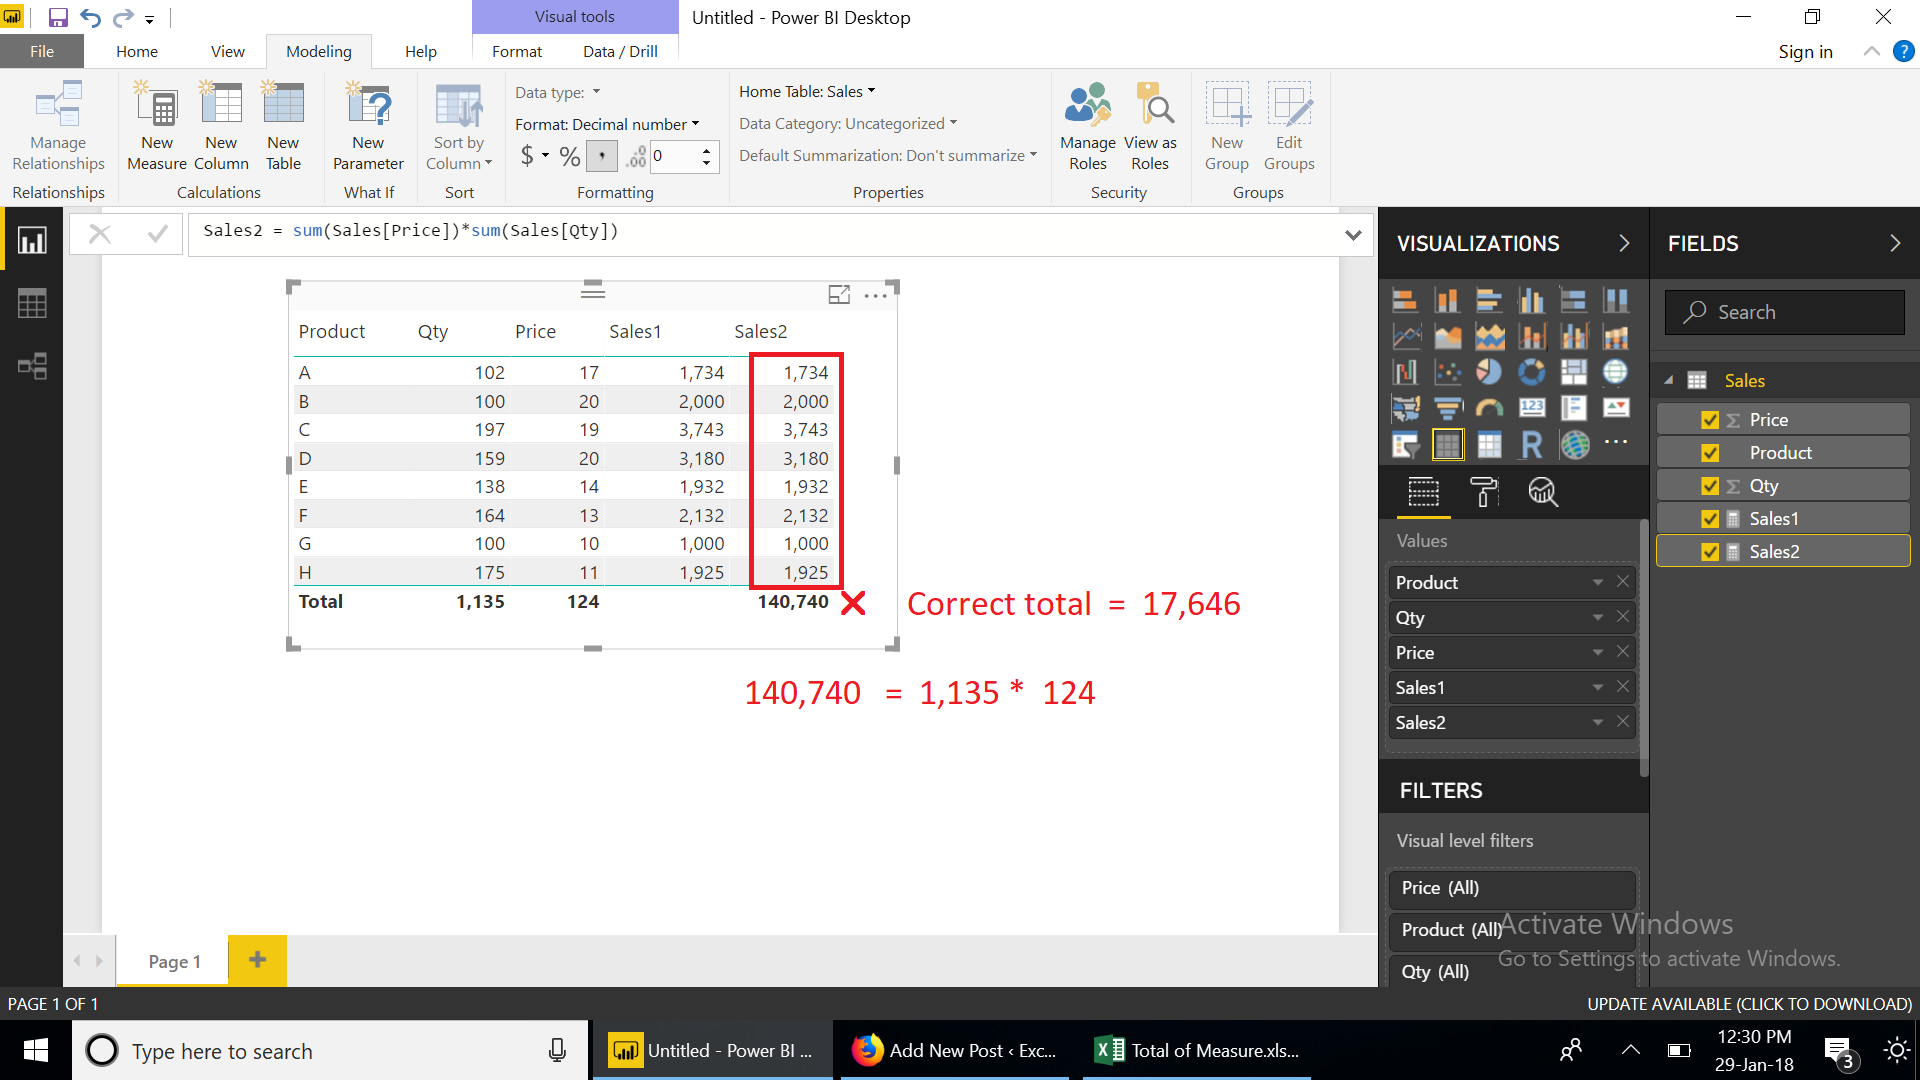
When a measure is used in a Table or Matrix Visualization, it is common to get either no total or an incorrect row/ column total.
A simple example will make it clear. We have following sales table
| Product | Qty | Price |
| A | 102 | 17 |
| B | 100 | 20 |
| C | 197 | 19 |
| D | 159 | 20 |
| E | 138 | 14 |
| F | 164 | 13 |
| G | 100 | 10 |
| H | 175 | 11 |
We add 2 Measures to it
Sales1 = SELECTEDVALUE(Sales[Price])*SELECTEDVALUE(Sales[Qty])
Sales2 = sum(Sales[Price])*sum(Sales[Qty])
And we get the following results
MEASURE does what it does. It applies the same logic or formula to the “Totals” which it applies to Normal Row and Column Values.
Therefore sum(Sales[Price])*sum(Sales[Qty]) applies for the total as well.
SELECTEDVALUE (ColumnName) returns value when the context for columnName has been filtered down to one distinct value only. Since the totals have more than one value…both SELECTEDVALUE(Sales[Price]) and SELECTEDVALUE(Sales[Qty]) return BLANK.
SOLUTION
The solution is to use the combination of HASONEVALUE and an ITERATOR (like SUMX, AVERAGEX, MINX, MAXX etc.)
i.e. the Correct MEASURE is
Sales =
IF (
 HASONEVALUE ( Sales[Product] ),
 SELECTEDVALUE ( Sales[Price] ) * SELECTEDVALUE ( Sales[Qty] ),
 SUMX (
 ALLSELECTED ( Sales[Product] ),
 CALCULATE ( SELECTEDVALUE ( Sales[Price] ) )
 * CALCULATE ( SELECTEDVALUE ( Sales[Qty] ) )
 )
)
This Code can be further simplified, since we already have the MEASURE….Sales1 = SELECTEDVALUE(Sales[Price])*SELECTEDVALUE(Sales[Qty])
So we can simple write the correct MEASURE as
Sales_ =
IF (
 HASONEVALUE ( Sales[Product] ),
 [Sales1],
 SUMX ( ALLSELECTED ( Sales[Product] ), [Sales1] )
)
Click here to download the pbix File

