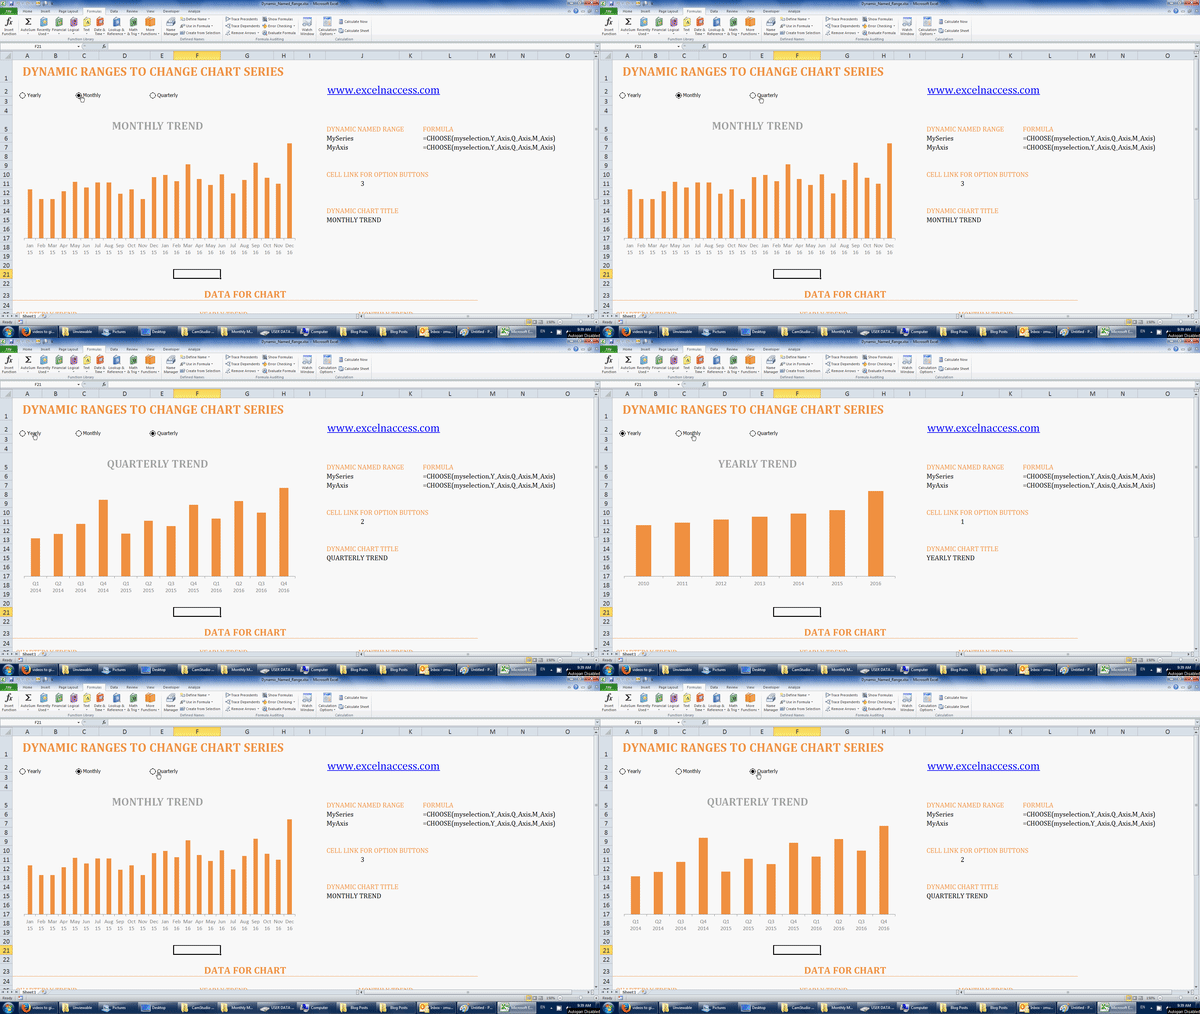
Dynamic Named Ranges can be very useful in creating Interactive Dashboards and Charts. I created the Interactive Chart below using Dynamic Named Range.

A Dynamic Named Range is a Named Range where there the “cell” or “Range of cells” it refers to, varies (expands, contracts or completely changes) based on certain Excel Events such as
- Clicking a form control/ active X control or selecting an item in it
- Selecting an item from a Drop Down (Data Validation) List
- User entering a value in a cell
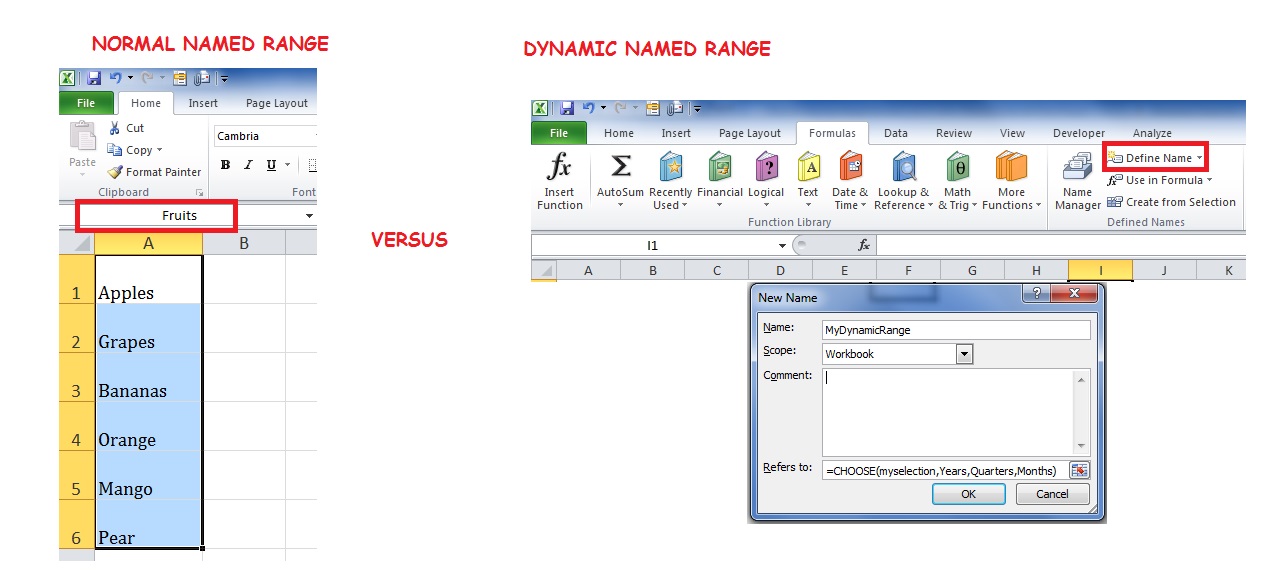
While a Normal Named Range is typically created by simply selecting a Cell or Range of Cells and then typing the name in the Name Box in the formula bar, a Dynamic Named Range can only be created by using New Name Dialog Box and by specifying the formula in the “Refers to” section of the Dialog Box. The picture below illustrates this difference

Click to download the sample file and see the formula and technique used.
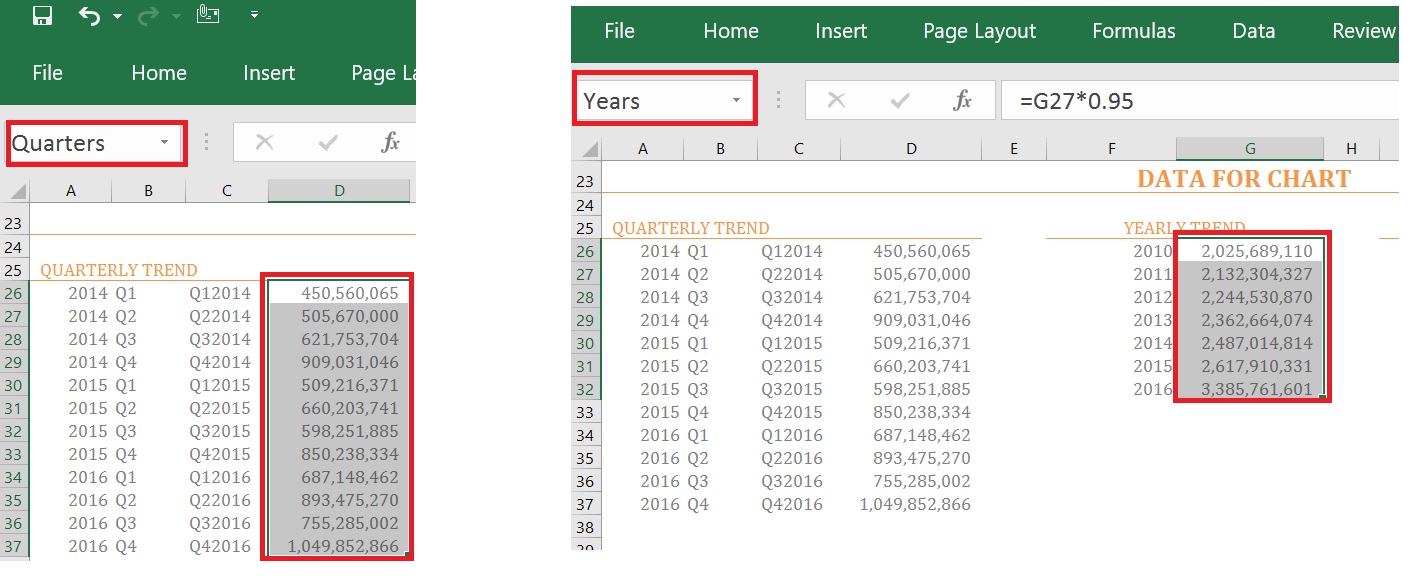
In this file, have 3 sets of data i.e. Quarterly, Monthly and Yearly data. I have created Normal Named Ranges on this data as shown below

The next step is to insert three “Option Buttons (form controls)” from “Developer” tab>> Controls in Excel and then use the common Cell Link of these Option Buttons to create a Dynamic Named Range
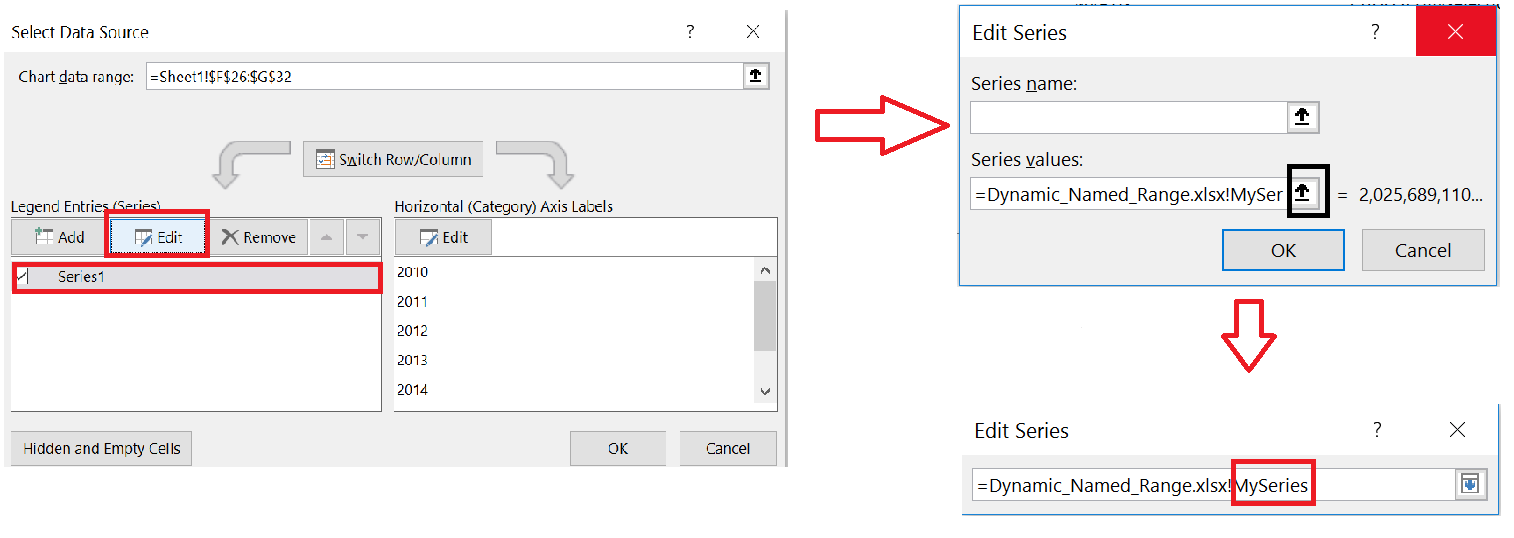
The Final step is to link the Chart’s Source Data to Dynamic Named Range we created. This is depicted in the picture below
